Quickly deploy a complete single-node instance with all platform services on one machine. Single-node installations are suitable for testing, proof-of-concept, and small-scale environments.
The single-node installation steps for v3.5.1 are identical to v3.5.0. If you have previously installed v3.5.0 using this guide, the same steps apply for v3.5.1 with the v3.5.1 installer package.
Overview
The single-node installation sets up all components (Frontend Node, Backend Nodes, and Scan Node) on a single machine. This configuration is recommended for:
-
Small deployments with limited data volume
-
Testing environments
-
Proof-of-concept
Prerequisites
Operating System Requirements
The following Linux operating systems are supported for the node server:
-
Officially supported: Red Hat Enterprise Linux 9+
-
Compatible (expected to work): CentOS 9+, Alma Linux 9+
System requirements
The node server needs to meet the following minimum requirements:
|
Requirements |
Minimum |
|---|---|
|
CPU cores |
4 |
|
Memory |
32GB |
|
Disk space |
50GB |
Install User
The installing user must have sudo rights on the node in order to use required scripts such as tune.sh.
Network and Firewall
Review the following network and firewall considerations:
Internal Services: There are no network requirements for internal service traffic as all services are contained on a single node in this configuration.
Post-Installation Network Considerations for Sensor and Connector Scans:
Platform and API Scans: Node will require egress network access to the environments users want to scan.
Remote Scans: Sensors or Connectors will need ingress network access to the node’s ingestion endpoint for data communication. Running scans remotely does not require egress network connectivity from the node.
See Sensors for specific Sensor and Connector information.
Ingestion Endpoint information is provided by the platform at the end of installation. The format is https://<analytics_hostname>.<analytics_domain>:<ingestion service port>. With default values, this is https://agilesec.kf-agilesec.com:8443.
Optional: Provide Your Own Certificate Requirements
The platform uses mutual TLS (mTLS) for secure authenticated communication between all services and server components.
All required certificates can be generated and self-signed, or you can provide your own certificates.
If you intend to bring your own certificates (BYOC) from a public CA or enterprise PKI rather than using self-signed installer-generated certificates, review BYOC: Prerequisites. Ensure prerequisites are met and determine all required install configuration details for proper certificate management.
External Domain Name Requirements
A single external FQDN for AgileSec platform access is required. When assigning configuration variables during installation instructions in provided guides, the external FQDN will be <analytics_hostname>.<analytics_domain>.
The following format is recommended: agilesec.<external domain>
For example: agilesec.dilithiumbank.com.
Do not update your node server’s /etc/hosts file at this time. The tune.sh script will automatically add the needed lines.
Prepare Installation Files
Ensure your node meets the minimum memory, CPU, and disk requirements.
-
Download the installation zip archive from the Keyfactor download portal to the node server.
-
Extract the zip archive
<installer_package>.zipto your preferred install locationinstaller_dir:unzip -d $installer_dir <installer_package>.zip cd $installer_dirNote: To install unzip on RHEL, run
sudo dnf install unzip. -
Ensure the installation script is executable:
Javacd $installer_dir chmod +x install_analytics.sh
Create a .pass Password file
It is highly recommended users create a .pass file for non-interactive mode. When running in non-interactive mode, the install_analytics.sh script reads the admin password from a .pass file.
By default, password requirements include minimum 14 characters, at least 1 uppercase letter, at least 1 number, and at least 1 special character from `@ ! # $ & ?`.
-
Copy the example file:
cp .pass.example .pass.-
To see all files, including files starting with a
., usels -a
-
-
Edit
.passand setadmin_password. Save the file and exit the editor. -
Set secure permissions:
chmod 600 .pass
Note: .pass should be located in installer_directory.
Installation Overview
The installation can be performed in two modes: Interactive (default) or Non-Interactive (for automated/CI-CD deployments).
Non-Interactive Mode
All key installation scripts support an optional --non-interactive (or -n) flag to skip confirmation prompts, enabling fully automated deployments.
|
Script |
Non-Interactive Flag |
Behavior |
|---|---|---|
|
|
|
Overwrites existing env files without prompting. |
|
|
|
Overwrites existing certificate files without prompting. |
|
|
|
Skips all confirmation prompts; overwrites existing files in |
|
|
|
Skips uninstall confirmation prompt. |
Step 1: Prepare the Environment
Ensure you have the installer package and your node meets the minimum memory and CPU requirements.
Update Single-Node Configuration
Environment configuration is required before starting the installation. A configuration file with default values for a single-node installation is available at generate_envs/single_node_config.conf. This file will be used by generate_envs.sh.
You may use the default values for all settings. However, it is recommended to review and update the following settings for single-node installations:
|
single_node_config.conf Setting |
Purpose |
Default |
|---|---|---|
|
|
Organization name used by the platform |
|
|
|
Primary external-facing hostname (FQDN host portion) for the platform. |
|
|
|
Primary external-facing domain for the platform. |
|
|
|
Domain name for creating org to map to indexes in OpenSearch. Note: The default admin username will be The default admin user is a Platform Admin, the highest permissioned role. Post-installation, Platform Admins may reset passwords, add additional users, set up SSO logins via UI, and more. Note: OpenSearch does not support subdomains. If |
Equal to
|
|
|
External-facing port for accessing the platform. |
|
|
|
Base Distinguished Name (DN) used to generate server certificates. |
|
|
|
Base DN used to generate internal client certificates. |
|
|
|
Enables support for v2 sensors. When enabled, Fluentd (td-agent) is installed alongside the Indexing Service for backward compatibility with v2 sensor data ingestion. |
|
|
|
Internal domain used for internal node communication and certificate file folder name when generating certificates. |
|
[Optional] Using Port 443 (HTTPS Standard Port)
To run the platform on the standard HTTPS port (443) instead of the default 8443, set analytics_port=443 in generate_envs/single_node_config.conf before running generate_envs.sh. Then proceed with the normal installation steps.
When using port 443, be aware of the following post-install behavior:
-
Since port 443 is a privileged port (< 1024), HAProxy requires root privileges to bind to it.
-
./manage.sh startas a regular user will start all services except HAProxy. -
Post-installation, HAProxy must be started or restarted with sudo in
agilesec_install_dir:
cd $agilesec_install_dir
sudo ./scripts/manage.sh start haproxy
-
However, stopping HAProxy does not require sudo:
cd $agilesec_install_dir
./scripts/manage.sh stop haproxy
-
The platform URL simplifies to
https://<analytics_hostname>.<analytics_domain>(no port number needed, since 443 is the default HTTPS port).
Generate Configuration File for Single-Node Installation
Run the following command:
cd $installer_dir
./generate_envs/generate_envs.sh -t single-node
generate_envs.sh will copy $installer_dir/generate_envs/generated_envs/env.backend-1env.single_node to $installer_dir/.env.
The script has the following additional option flags available. Installation options can also be found by running ./generate_envs/generate_envs.sh --help.
|
generate_envs.sh short flag |
Required |
Description |
|---|---|---|
|
|
Yes |
Specify installation type: |
|
|
No |
Multi-node installs only: specify a specific node to generate. |
|
|
No |
Path to a previous, older config file for upgrade. Merges customer values from old config into new template. |
|
|
No |
Non-interactive mode: no prompts, overwrite files. |
Setup Certificates
Either generate and self-sign all required certificates using generate_certs.sh, or use certificates issued by your own CA. For POCs and first-time installations, it is recommended you use installer-generated certificates.
Run the following command to generate and self-sign all required certificates:
cd $installer_dir/certificates/
./generate_certs.sh
cd ..
This command will populate the required certificate files under the certificates directory.
Note: The .env config file is required to generate certificates. By default, the script looks for the .env file under <installation directory>.
For additional Certificate Management options and details, including using your own certificates, see On-Prem Certificates Management Guide.
External Browser FQDN Access Setup
Ensure external computer(s) where you will be accessing the AgileSec Platform UI from have at least one of the following for browser access:
-
Recommended for general multi-computer access: A DNS entry for
<analytics_hostname>.<analytics_domain>pointing to the node’s IP address. -
For quick proof of concept, test cases, or single computer access: An entry in your
/etc/hostsfor<analytics_hostname>.<analytics_domain>pointing to the node’s IP address.
Create a .pass Password file
It is highly recommended users create a .pass file for non-interactive mode. When running in non-interactive mode, the install_analytics.sh script reads the admin password from a .pass file. To set this up:
-
Copy the example file:
cp .pass.example .pass.-
To see all files, including files starting with a
., usels -a
-
-
Edit
.passand setadmin_password. Save the file and exit the editor. -
Set secure permissions:
chmod 600 .pass
The .pass file should be located in the installer_dir top level.
Step 2: Install the Platform
Check Environment Setup
Make sure settings file $installer_dir/.env is present.
Tip: Use ls -a to see files beginning with a .
Run tune.sh Script
cd $installer_dir
sudo ./scripts/tune.sh -u <username>
tune.sh updates the following:
-
System settings for
Sysctlsettings. Recommended values are:-
vm.max_map_count = 262144 -
fs.file-max = 65536
-
-
Security settings in
/etc/security/limits.conffor file descriptors and number of threads. These settings are needed by OpenSearch:-
<non-root-user> - nofile 65536 -
<non-root-user> - nproc 65536 -
<non-root-user> soft memlock unlimited -
<non-root-user> hard memlock unlimited
-
-
Adds
/etc/hostsentries on node server to support internal and/or external communication.-
Note: Only entries with private IP addresses for internal nodes are added to
/etc/hostsbytune.sh
-
-
Installs internal CA chain into the node trust stores used by AgileSec components.
-
Install git binary
Alternately, you can perform the above steps manually.
The script has the following additional option flags available. Installation options can also be found by running sudo ./tune.sh --help.
|
tune.sh short flag |
Required |
Description |
|---|---|---|
|
|
Yes |
Username to apply system tunings for. |
|
|
No |
Multi-node installation only. Specifies the node role. |
|
|
No |
Path to .env file. Defaults to |
Run Installation Script
Note about install script backwards compatibility:
For fresh installations in versions 3.5.0+, use the install sub-command for performing fresh installations with install_analytics.sh:
./install_analytics.sh install [OPTIONS]
For backwards compatibility, running ./install_analytics.sh [OPTIONS] without the install sub-command continues to work as in previous versions.
install_analytics install installs the software for the AgileSec node.
To run interactively (will prompt for admin password on console):
./install_analytics.sh install -u <user> -p $agilesec_install_dir
To run non-interactively (will use .pass file for password):
cd $installer_dir
./install_analytics.sh install -u <user> -p $agilesec_install_dir --non-interactive
Note: $agilesec_install_dir is a new, separate directory where AgileSec is installed to.
If any required parameters are omitted, the script will prompt you to enter them interactively.
The script has the following option flags available. Installation options can also be found by running ./install_analytics.sh install --help.
|
install_analytics.sh install short flag |
Required |
Description |
|---|---|---|
|
|
Yes |
Specify the username to run processes as |
|
|
Yes |
Specify the installation path |
|
|
No |
Specify the group name to run processes as. Defaults to username. |
|
|
No |
Multi-node installation only. Specifies the node role. |
|
|
No |
Non-interactive mode: no prompts, overwrite files. |
|
|
No |
Verbose mode: Enables verbose debug output. |
URL and Login Info
After successful installation, the installer will output an install summary with login URLs and login info. This information can also be found in $installer_dir/INSTALL_SUMMARY.txt.
Web UI information example:
-
Login URL:
https://<analytics_hostname>.<analytics_domain>:<analytics_port> -
Username:
admin@<org_domain> -
Password: <the admin password you entered at the beginning of install>
Example: End-to-End Non-Interactive Single-Node Install
cd $installer_dir

# Generate env config
./generate_envs/generate_envs.sh -t single-node --non-interactive

# Generate certificates
cd certificates/
./generate_certs.sh --non-interactive
cd ..

# Prepare .pass file
cp .pass.example .pass
# Edit .pass and set admin_password
chmod 600 .pass

# Run system tuning
sudo ./scripts/tune.sh -u <user>

# Install
./install_analytics.sh install -u <user> -p $agilesec_install_dir --non-interactive
After installation, the following scripts can be used from agilesec_install_dir/scripts:
-
manage.sh: Manage services. See Managing Services for details. -
uninstall.sh: Uninstalls the AgileSec platform. cleans up ports, cron, /etc/hosts, installation directory, etc. -
startup.sh: Enables auto-start after reboot. -
health_check.sh: Checks services and attempts to start any with “Not running” status.
Post-Installation Verification
Verify Service Health
From agilesec_install_dir, run ./scripts/manage.sh status to check the status of all services. If any service shows Not running, try restarting it. See Managing Services for instructions on starting and restarting services.
The following services should have Running status:
$ ./scripts/manage.sh status
SERVICE                   DESCRIPTION                              STATUS
------------------------  ---------------------------------------- --------------------
opensearch                OpenSearch Search Engine                 Running (PID: 1450891)
opensearch-dashboards     OpenSearch Dashboards                    Running (PID: 1452817)
indexing                  Indexing Microservice                    Running (PID: 1451400)
haproxy                   HAProxy Load Balancer                    Running (PID: 1451285)
mongodb                   MongoDB Server                           Running (PID: 1451281)
kafka                     Kafka Server                             Running (PID: 1451295)
webui                     Web UI Microservice                      Running (PID: 1451316)
api                       Web API Microservice                     Running (PID: 1452924)
cbom                      CBOM Exporter Microservice               Running (PID: 1453074)
sm                        Security Manager Microservice            Running (PID: 1453083)
analytics-manager         Analytics Manager Microservice           Running (PID: 1451408)
ingestion                 Ingestion Microservice                   Running (PID: 1451419)
scheduler                 Scheduler Microservice                   Running (PID: 1451450)
*Note: If v2_sensors is enabled in the .conf prior to install, you should also see td-agent Fluentd Data Collector service running.
After installation completes, allow approximately 30 seconds for all services to fully initialize before accessing the UI. Attempting to log in immediately may result in a 503 Service Unavailable error. If this occurs, wait 30 seconds and refresh the page.
Access the Platform UI
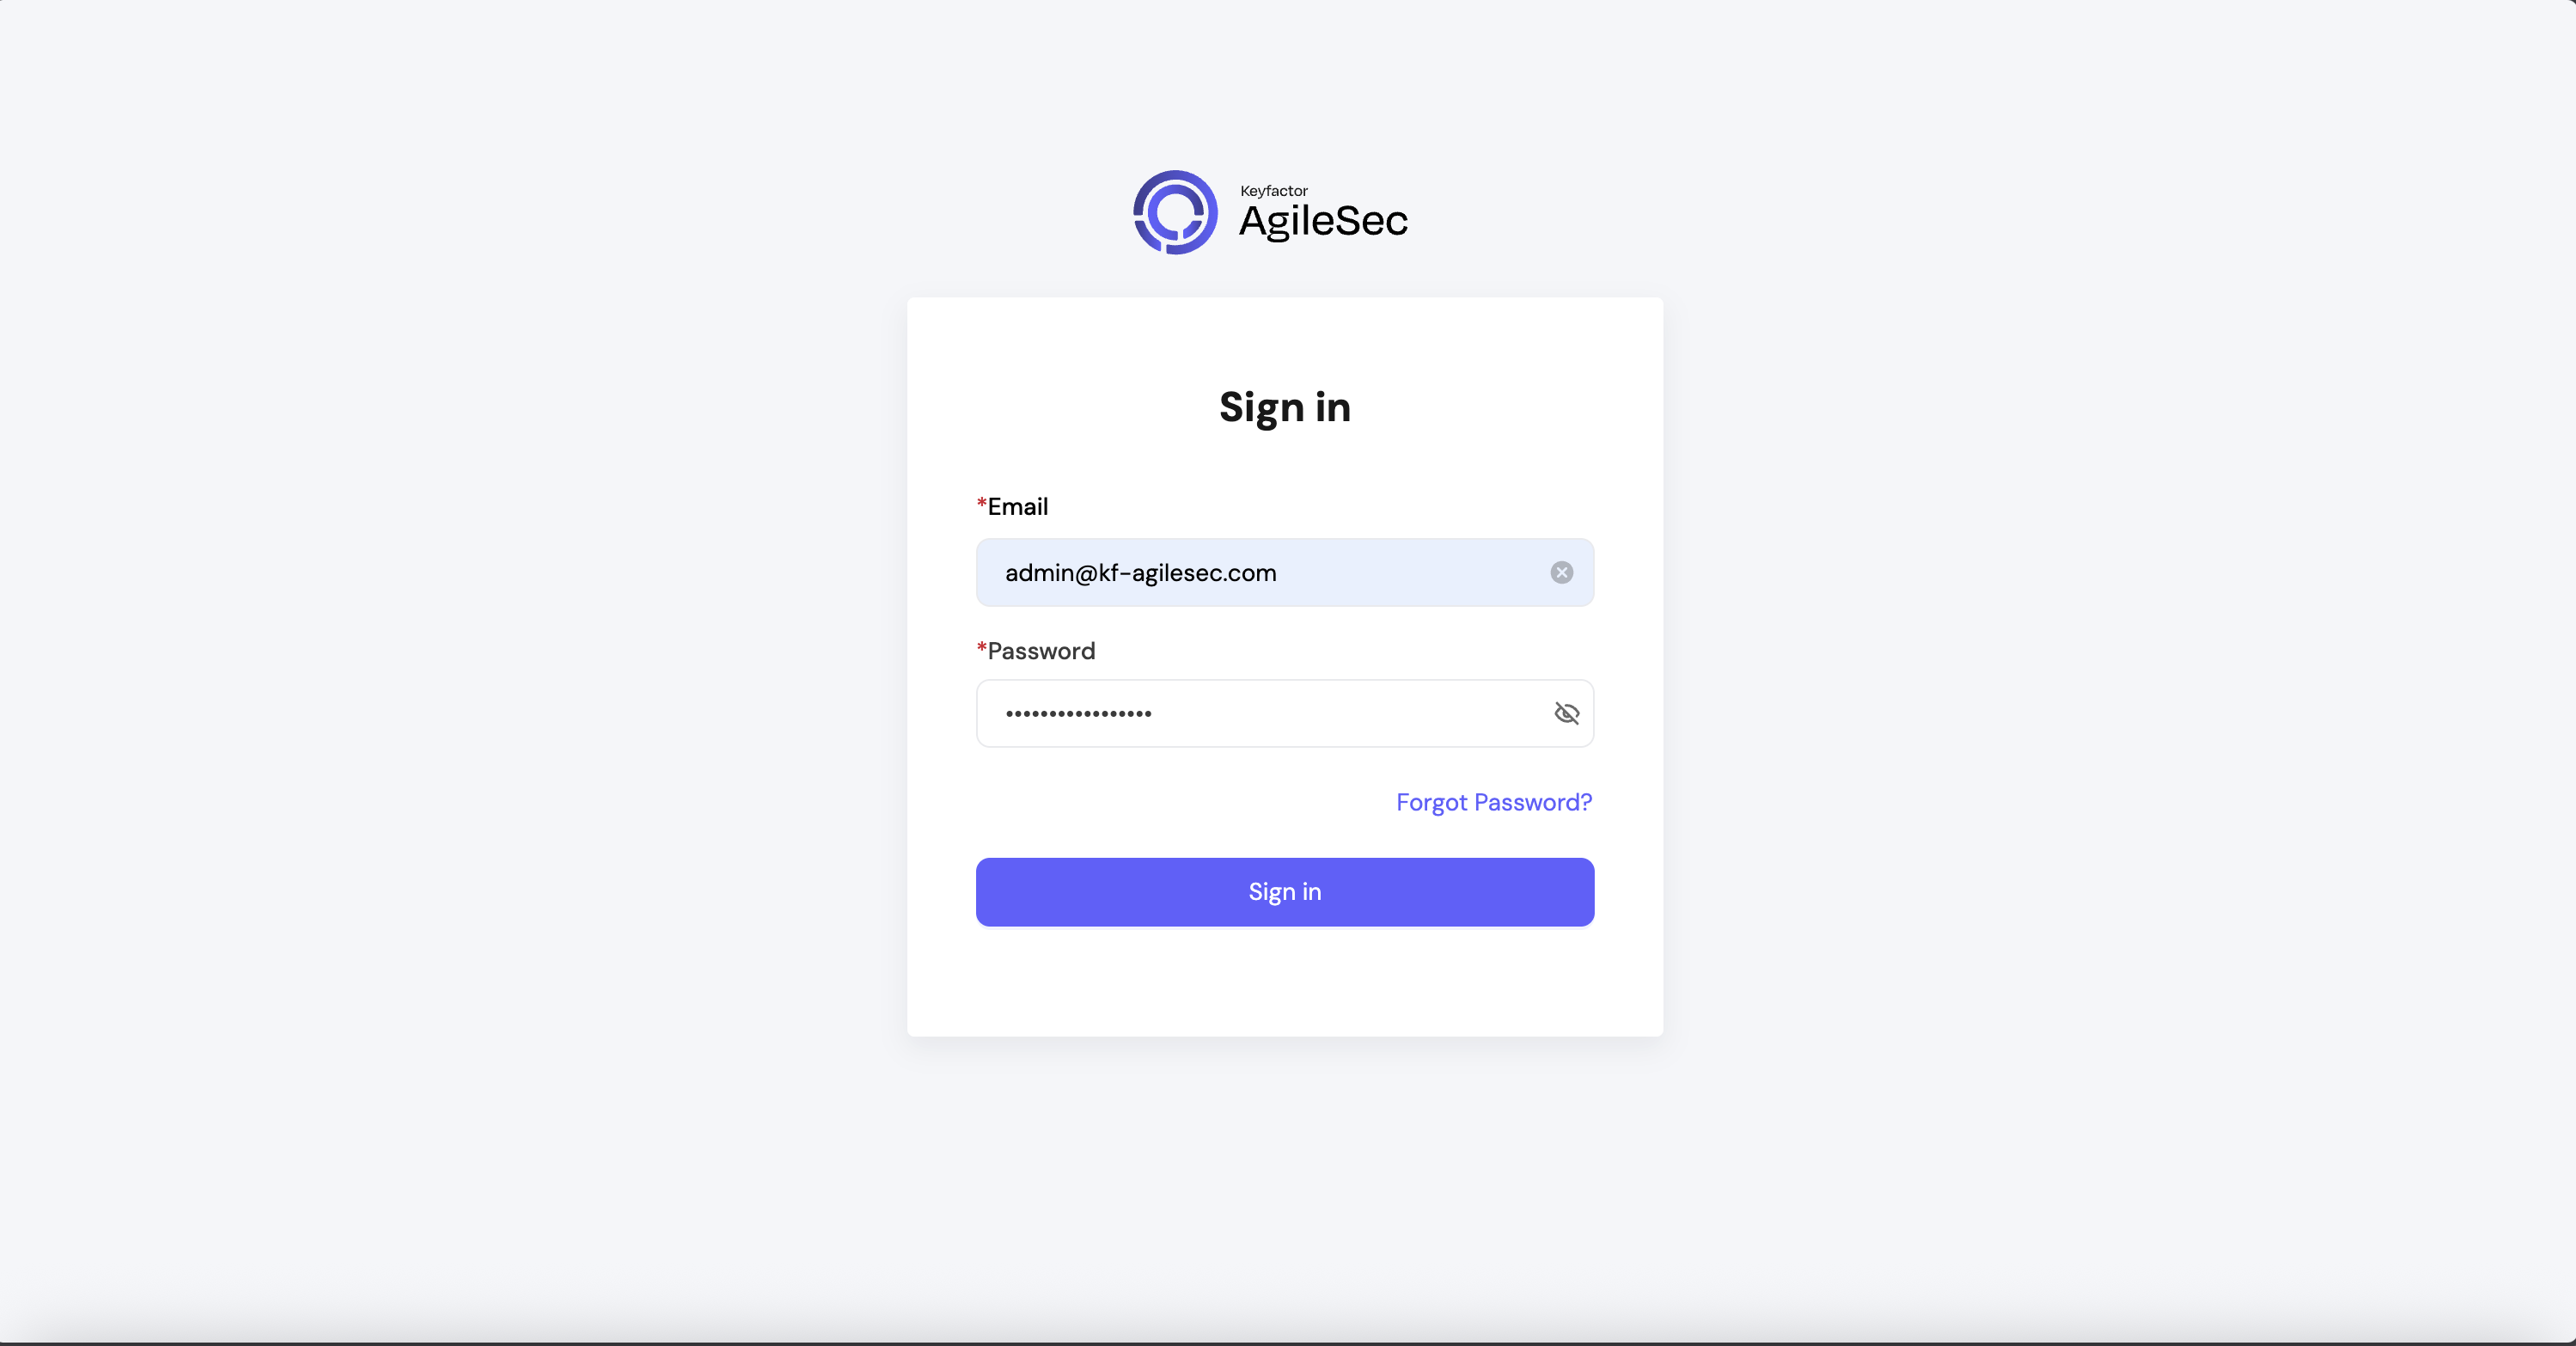
To log into the new Web UI, use the URL displayed at the end of the install or in $installer_dir/INSTALL_SUMMARY.txt:
For example, using the default settings:
-
Login URL:
https://agilesec.kf-agilesec.com:8443 -
Username:
admin@kf-agilesec.com -
Password:
HelloWorld123456!
You will see a login screen like this:
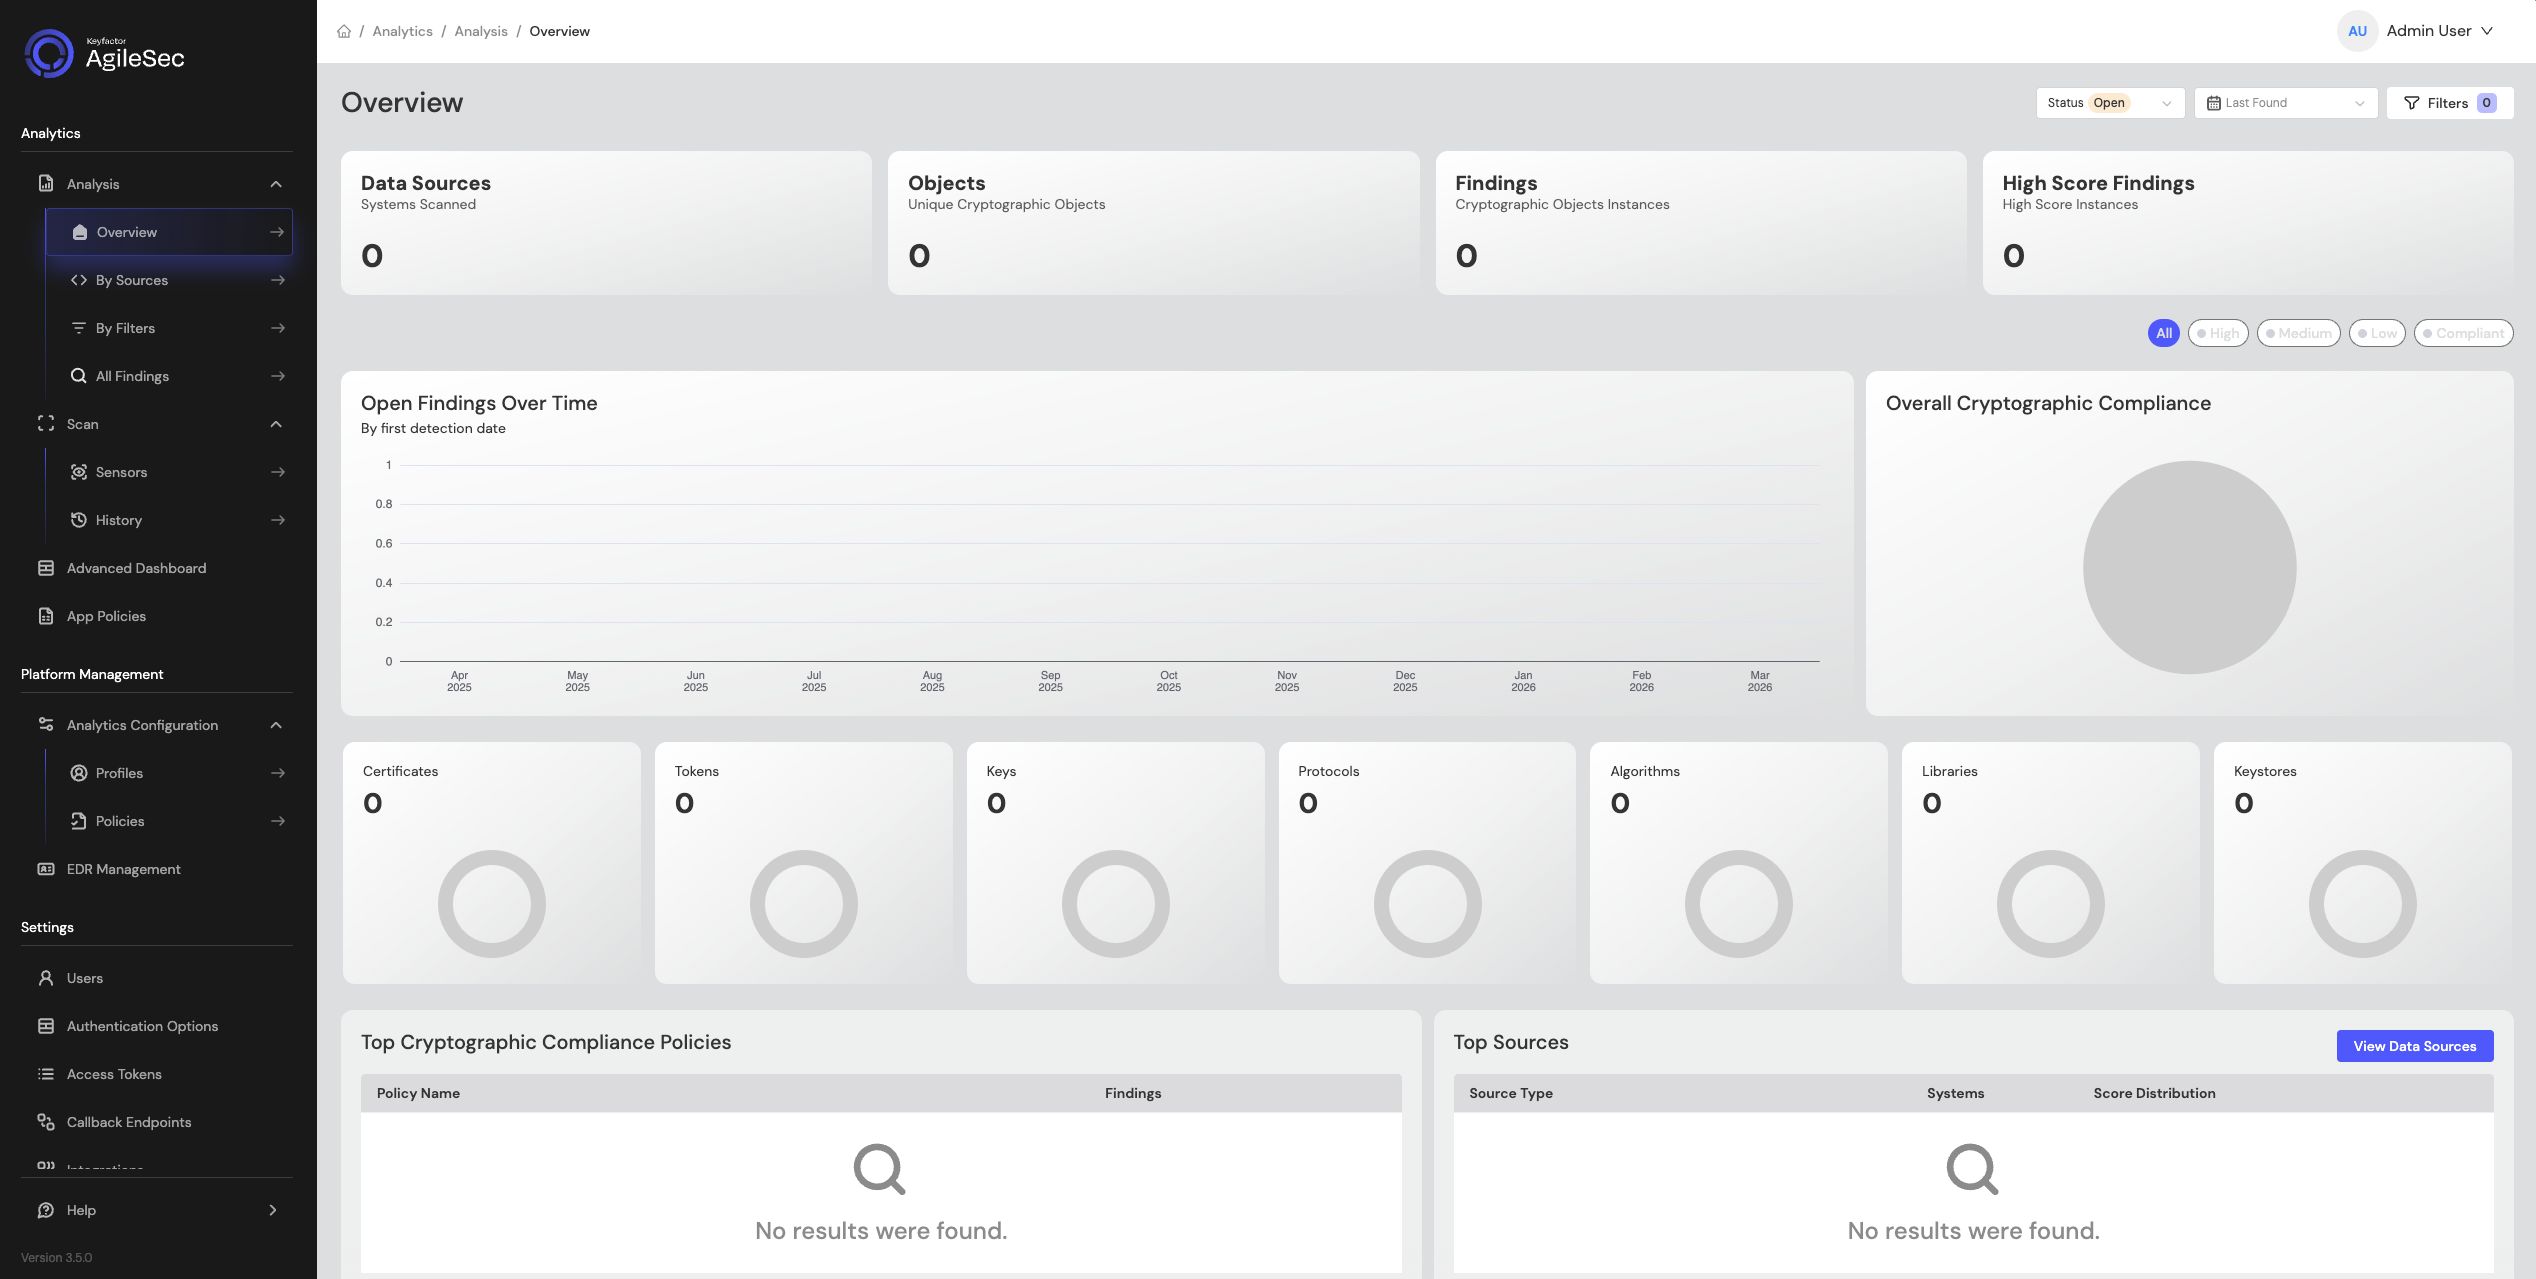
After logging in, the Overview Dashboard should show 0 across all charts, as shown in the screenshot below: